TUTORIALS
Tracking Usage and Performance in the Dashboard(대시보드에서 사용량 및 성능 추적)
The Dashboard presents key information about performance and usage activity. You can use it to get a good understanding of the activity on your Algolia account—like knowing what your users are doing, and how fast, and what sort of API operations are being performed. All this provides an open window into your application’s API usage.
This information helps you in two significant ways. First, to help you tweak your data and index configurations to achieve greater relevance, speed, and efficiency. Secondly, to offer you a simple way to monitor the billable activity of your account.
This tutorial will focus on the API Monitoring Dashboard Section. If you aren’t familiar with the Dashboard, please take a look at the Dashboard Overview tutorial.
대시보드는 성능 및 사용 활동에 대한 주요 정보를 제공합니다. 사용자가 수행하는 작업, 속도 및 수행 중인 API 작업의 종류를 파악하는 등 Algolia 계정에서 수행되는 작업을 잘 이해하는 데 사용할 수 있습니다. 이 모든 것은 응용 프로그램의 API 사용에 대한 열린 창을 제공합니다.
이 정보는 두 가지 중요한 방법으로 도움이 됩니다. 첫째, 데이터 및 인덱스 구성을 조정하여 관련성, 속도 및 효율성을 높일 수 있습니다. 둘째로, 당신의 계정의 청구 가능한 활동을 감시할 수 있는 간단한 방법을 제공하기 위해서입니다.
이 튜토리얼에서는 API 모니터링 대시보드 섹션을 중점적으로 설명합니다. Dashboard에 대해 잘 모르는 경우 Dashboard Overview 튜토리얼을 참조하십시오.
As you go through this tutorial, you may want to experiment with different searches and indexing operations to help make these metrics concrete and meaningful. You can do this with your API or within the Indexing section of the Dashboard. Ultimately, the goal is to give you more control over the Algolia search engine.
이 튜토리얼을 진행하면서, 이러한 메트릭을 구체적이고 의미 있게 만들기 위해 다양한 검색 및 인덱싱 작업을 실험해 볼 수 있습니다. API를 사용하거나 대시보드의 인덱싱 섹션에서 이 작업을 수행할 수 있습니다. 궁극적으로는 알골리아 검색 엔진에 대한 통제력을 높이는 것이 목표입니다.
Performance metrics(메트릭 성능)
Performance is a good place to start—click on the API Monitoring section in the sidebar, then the Performance section.
성능을 시작하기 좋습니다. 사이드바에서 API Monitoring(API 모니터링) 섹션을 클릭한 다음 Performance(성능) 섹션을 클릭합니다.
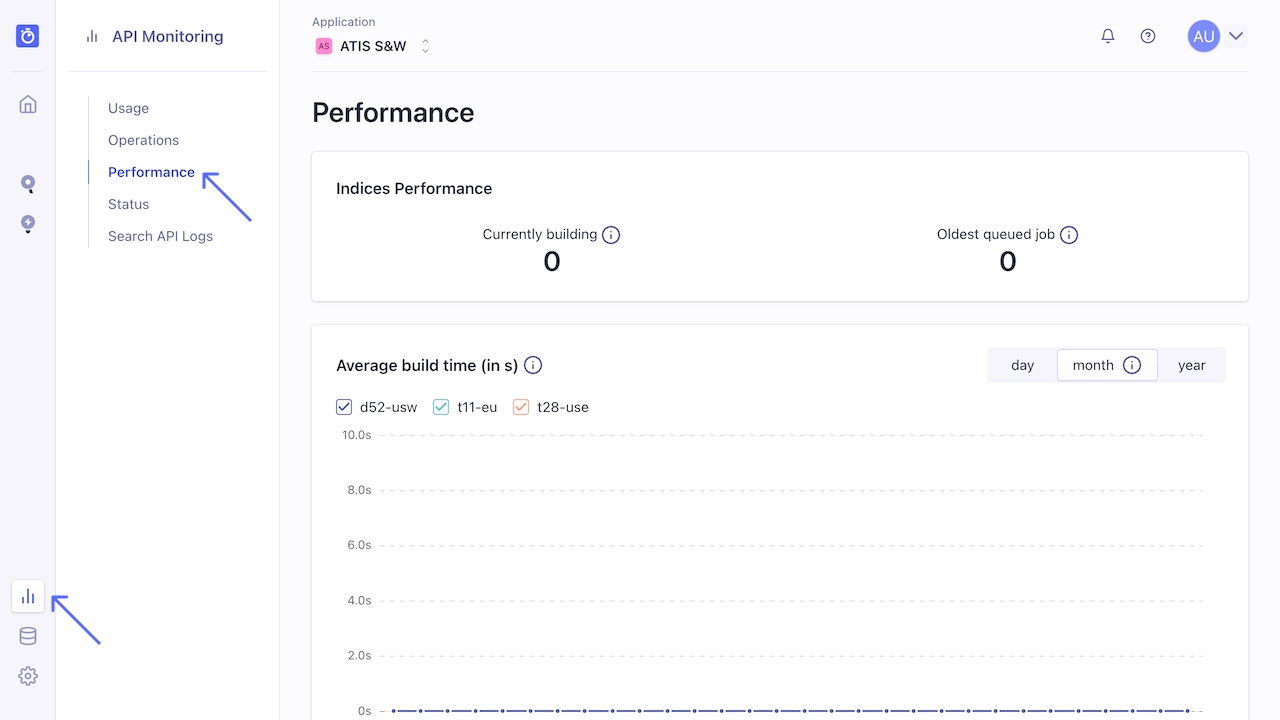
On this page you’ll see a full view of the number and speeds of your search operations. These figures are broken into 90% and 99% percentiles. You can also view graphs over a day, divided into hours, over the past month, and over the past year. Note that the speeds measured here are the times it takes the Algolia server to process a search request.
이 페이지에서 검색 작업의 수와 속도를 전체적으로 볼 수 있습니다. 이 수치들은 90퍼센트와 99퍼센티지수로 나뉜다. 또한 하루 동안의 그래프를 시간, 지난 한 달 및 지난 1년 동안 볼 수 있습니다. 여기서 측정된 속도는 Algolia 서버가 검색 요청을 처리하는 데 걸리는 시간입니다.

The Queries per Second view can be used to check whether large user search activity has any impact on performance.초당 쿼리 보기는 대규모 사용자 검색 활동이 성능에 영향을 미치는지 여부를 확인하는 데 사용할 수 있습니다.
Measuring speed(속도 측정)
Algolia measures performance in milliseconds. Larger values might indicate a performance problem. Additionally, since processing time only measures the speed of the Algolia servers, you need to add network latency and front-end display times to measure the full user experience. Delivering the best UX means that the total time, from keystroke to displaying search results, should be less than 100 ms, as this delivers a real search as you type experience. Thus, with this 100 ms benchmark, and an average latency of 70 ms, the engine’s processing time should be no greater than 30 ms, and ideally a lot lower.
알고리아는 성능을 밀리초 단위로 측정합니다. 값이 클수록 성능 문제가 있을 수 있습니다. 또한 처리 시간은 Algolia 서버의 속도만 측정하므로 전체 사용자 환경을 측정하려면 네트워크 지연 시간과 프런트 엔드 표시 시간을 추가해야 합니다. 최상의 UX를 제공한다는 것은 키 입력부터 검색 결과 표시까지의 총 시간이 100ms 미만이어야 한다는 것을 의미하며, 이는 사용자가 입력할 때 실제 검색을 제공하기 때문입니다. 따라서 이 100ms 벤치마크와 평균 대기 시간이 70ms일 때 엔진의 처리 시간은 30ms를 넘지 않아야 하며 이상적으로는 훨씬 짧아야 합니다.
Usage activity(사용량)
You can see your total number of records, as well as the number of search and indexing operations performed during the current billing cycle, under the Usage tab. The Records graph shows your total number of records. Whether you have a monthly or annual subscription, these figures will always reflect your application’s monthly usage. which will be used to generate an invoice at the end of your billing cycle.
총 레코드 수뿐만 아니라 현재 청구 주기 동안 수행된 검색 및 인덱싱 작업의 수를 사용량 탭에서 볼 수 있습니다. 레코드 그래프는 총 레코드 수를 표시합니다. 월간 구독이든 연간 구독이든 이 수치는 항상 응용 프로그램의 월간 사용량을 반영합니다. 청구 주기가 끝날 때 송장을 생성하는 데 사용됩니다.

In this section, you have as well a variety of timelines that trace your API usage. These too are broken down by hour, day, and month, for up to a year. The first of these displays the fluctuations of your total indices size over a fixed period of time. The remaining timelines display the execution count of nearly every operation within the API. These latter timelines are divided into seven kinds of operations - Search, Indexing, Record, ACL, Synonyms, Rules and Recommend - each of which are further divided into their associated API function calls.
As an example, look at the “Records Operations” graph. On the top left, you see 7 record-based operations: Get, Add, Batch, Delete, Partial update, Update and Delete by Query.
이 섹션에서는 API 사용량을 추적하는 다양한 시간 표시도 제공합니다. 이것들 역시 최대 1년 동안 시간, 일, 월 단위로 분류됩니다. 이 중 첫 번째 항목은 일정 기간 동안의 총 인덱스 크기의 변동을 표시합니다. 나머지 타임라인은 API 내의 거의 모든 작업의 실행 횟수를 표시합니다. 이러한 후반 타임라인은 검색, 인덱싱, 기록, ACL, 동의어, 규칙 및 권장의 7가지 작업으로 구분되며, 각 타임라인은 관련된 API 함수 호출로 더욱 세분화됩니다.
예를 들어, "레코드 작업" 그래프를 살펴봅니다. 왼쪽 위에는 7개의 레코드 기반 작업이 있습니다. 쿼리별 Get, Add, Batch, Delete, 부분 업데이트, Update 및 Delete.
To make things easier, you can also hover your mouse over the timeline to get a tooltip snapshot of all related operations for that particular hour, day, or month.
마우스를 타임라인 위로 가져가면 특정 시간, 일 또는 월의 모든 관련 작업에 대한 툴팁 스냅샷이 나타납니다.Note that usage statistics Note that usage statistics don’t include indexing operations on replicas, because keeping replicas in sync is done internally by the Algolia engine.
복제본 동기화는 알골리아 엔진에 의해 내부적으로 수행되므로, 사용 통계에는 복제본에 대한 색인 작업이 포함되지 않습니다.
Status section(상태)
Up to this point, this guide has described the performance and activity of your API usage. The next sections discuss infrastructure, specifically the latency and processing speeds of your servers, clusters, and DSNs.
지금까지 이 안내서에서는 API 사용의 성능 및 활동에 대해 설명했습니다. 다음 섹션에서는 인프라, 특히 서버, 클러스터 및 DSN의 지연 시간 및 처리 속도에 대해 설명합니다.
Alerts(알림)
There are several types of alerts to be aware of. 몇 가지 알아둬야 할 알림이 있습니다.
Status, where you set up either an email or a phone number to receive incident reports as they occur. The kinds of incidents reported are discussed in the API Status section.
Capacity, where you set up one or more Capacity Alerts to warn you before your servers overflow on memory and CPU usage. As you can see, the threshold for each metric can be configured. Take a look at the tutorial on How to set up capacity alerts.
상태 - 여기서 전자 메일 또는 전화 번호를 설정하여 사고 보고서가 발생할 때 이를 수신합니다. 보고된 인시던트의 종류는 API Status 섹션에서 설명합니다.
용량 - 서버가 메모리 및 CPU 사용량에 오버플로되기 전에 경고하도록 하나 이상의 용량 알림을 설정합니다. 보시다시피 각 메트릭에 대한 임계값을 구성할 수 있습니다. 용량 경고를 설정하는 방법에 대한 튜토리얼을 살펴봅니다.
Only plans with dedicated servers can receive capacity alerts. 전용 서버가 있는 Plan만 용량 알림을 받을 수 있습니다.
'개발 > Flutter' 카테고리의 다른 글
| flutter 내부 db 중에 매우 빠르다는 hive (0) | 2022.03.07 |
|---|---|
| Appbar back button color 변경 (0) | 2022.02.28 |
| flutter permission handler 최신 버전 iOS 안 될 때 (0) | 2022.02.27 |
| 알고리아 Gettingstart(1-1) (0) | 2022.02.24 |
| 예쁜 드롭다운 버튼 (pretty dropdown button from pub.dev) (0) | 2022.02.21 |
